March OC Newsletter
Quick Take:
Note: You can find the charts & graphs for the Big Story at the end of the following section.
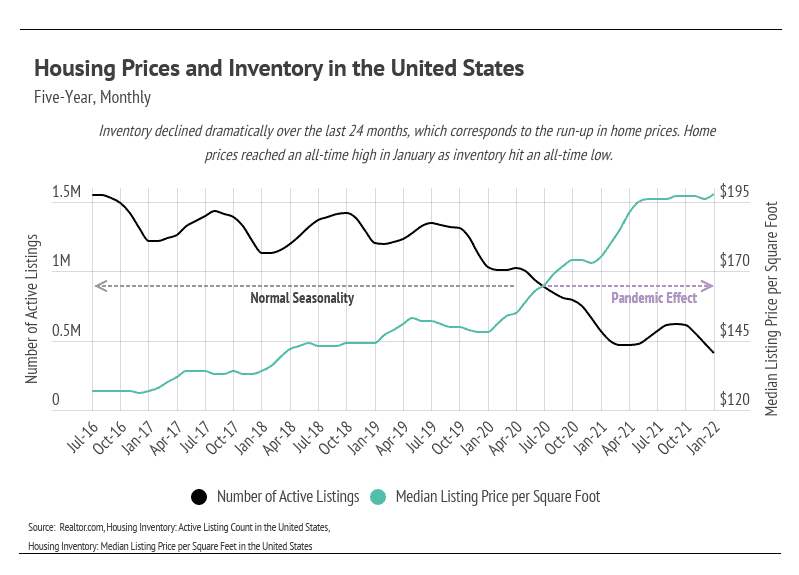
Amplified seasonal trends
|
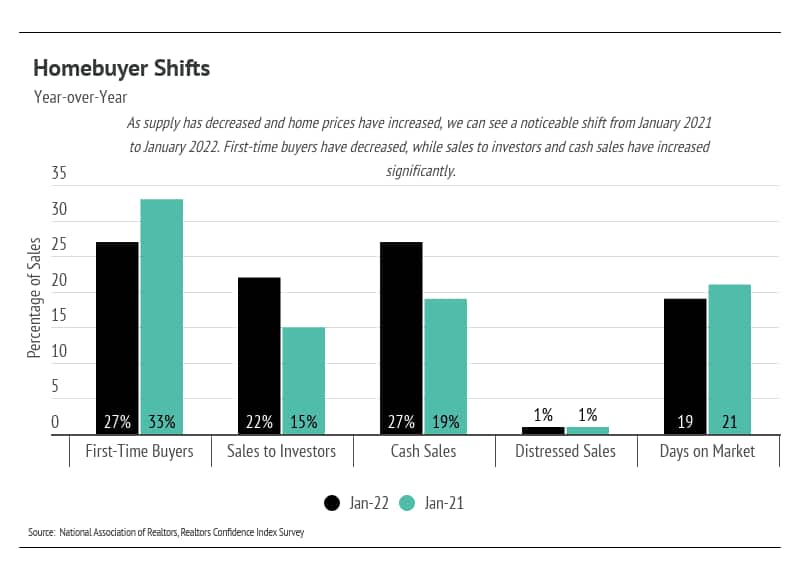
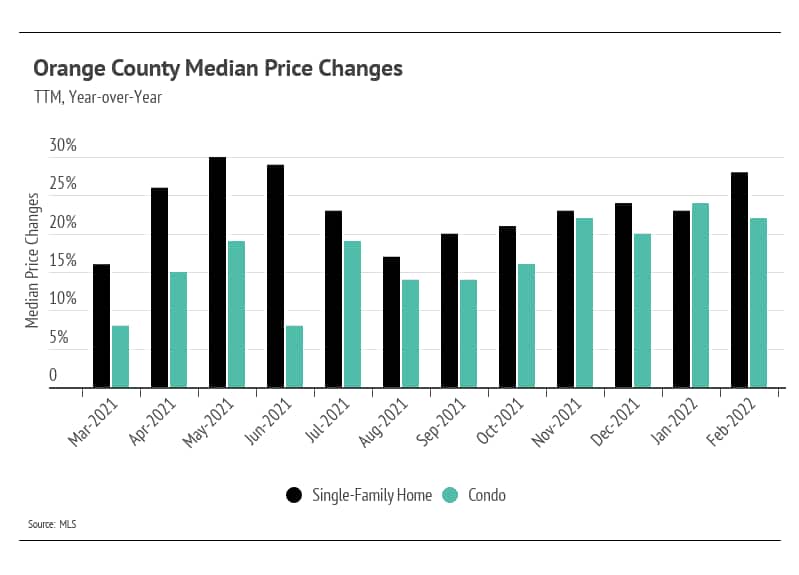
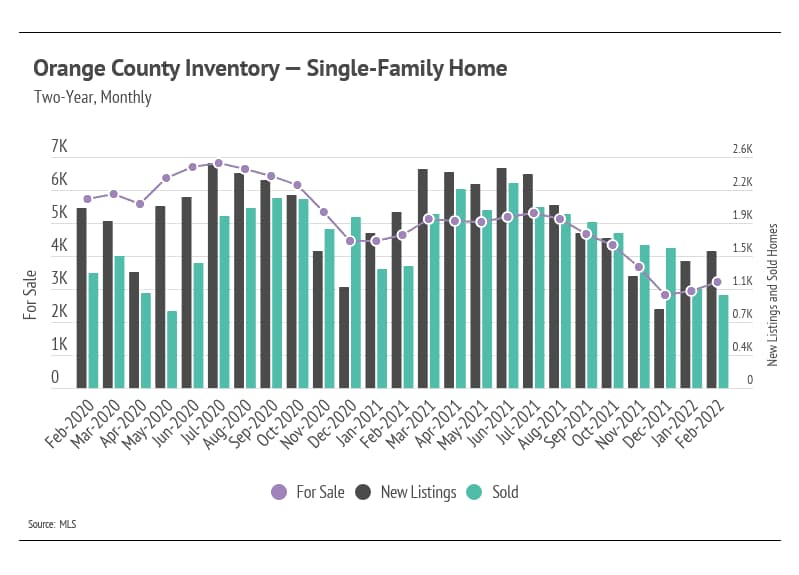
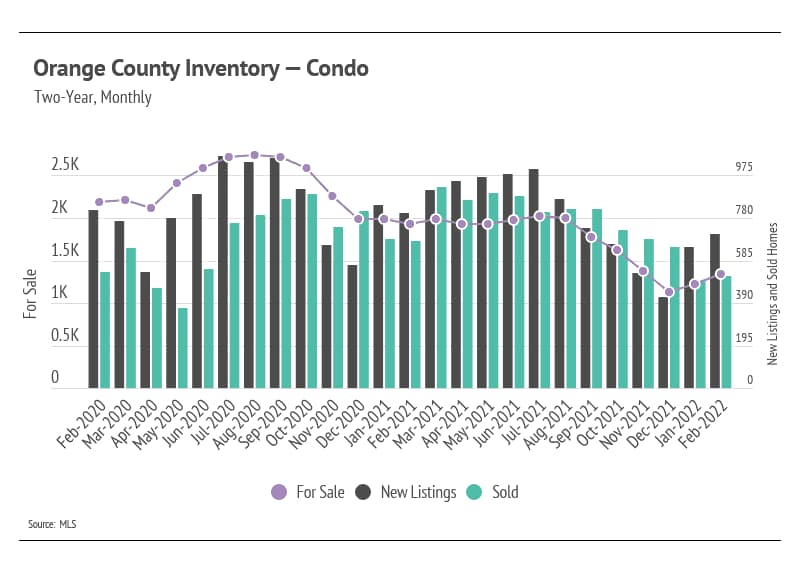
Seasonality in the housing market was incredibly steady before the pandemic. Prices typically rose from January to June, when inventory was low but rising, and then flattened from July to December, when inventory was high but declining. In January 2020, homes were already undersupplied, hitting a record low with just over a million homes for sale on the market. When the pandemic hit, demand for homes exploded, dropping inventory to shockingly low levels. During the 18 months between January 2020 and June 2021, inventory declined 49% and prices increased 32%, doubling the total price increase of the previous three years combined. By January 2022, inventory had reached an all-time low, down 60% in the past two years, while home prices reached a record high, up 34%. |
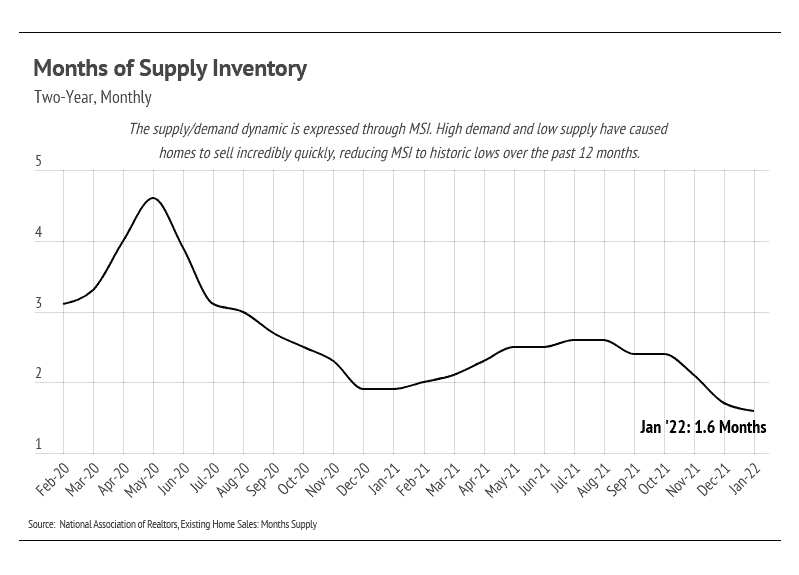
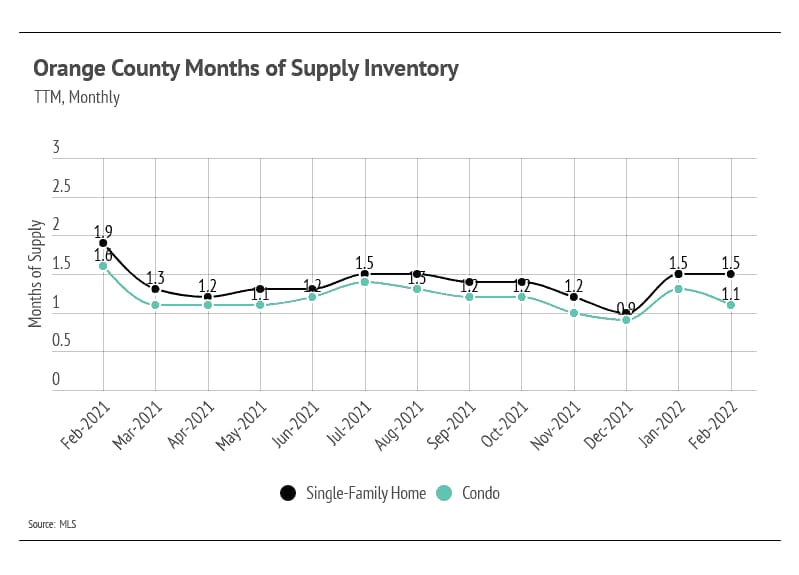
Record-low inventory persists
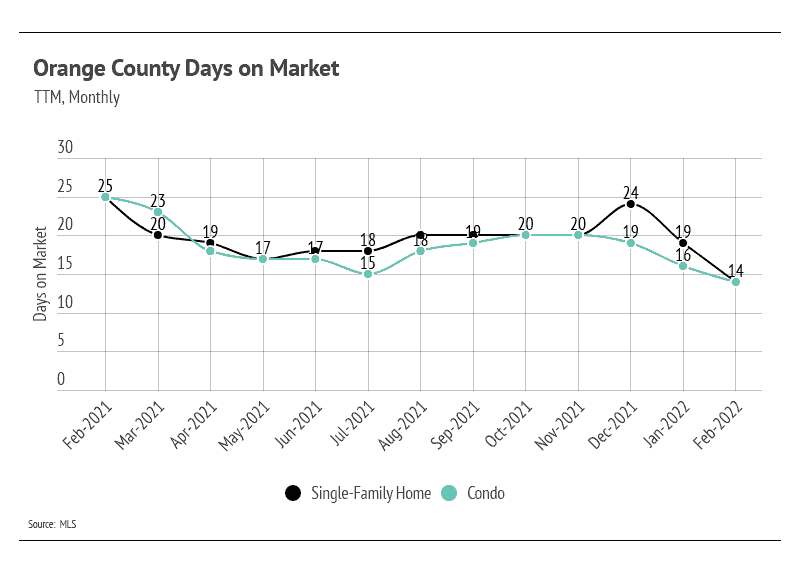
Months of Supply Inventory further indicates high demand and low supply
Stay up to date on the latest real estate trends.

Blog
Supporting Our Community: Resources and Ways to Help Los Angeles Recover from Wildfires


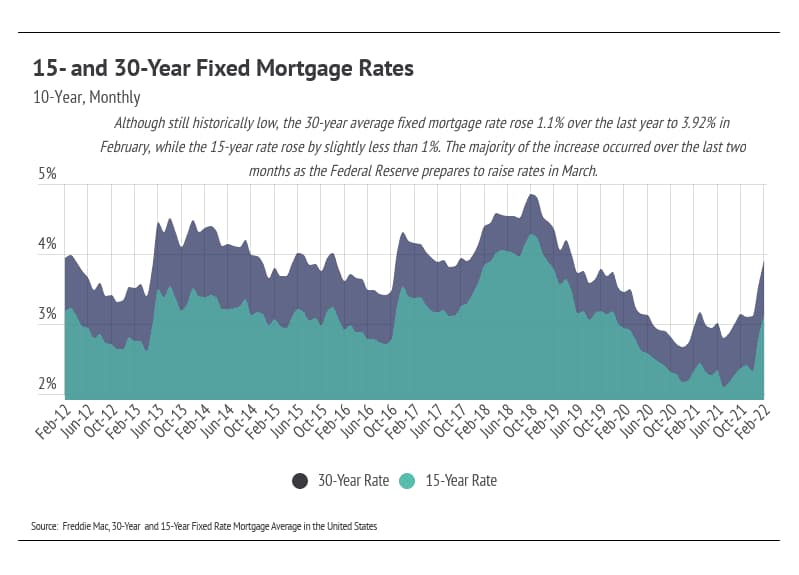
Quick Take: The Fed almost certainly will raise rates in March in an effort to combat inflation. Historically low supply is protecting the record-setting home prices o… Read more

If you’re planning to buy a home this year, saving for a down payment is one of the most important steps in the process. One of the best ways to jumpstart your savings… Read more

Over the past year, we’ve had plenty of opportunities to reflect on what we consider most important in our lives. The place we call home is one of the biggest things m… Read more

Over the past two years, the substantial imbalance of low housing supply and high buyer demand pushed home sales and buyer competition to new heights. But this year, t… Read more

With higher mortgage rates, you might be wondering if now’s the best time to buy a home. While the financial aspects are important to consider, there are also powerful… Read more

As the market has cooled this year, some of the intensity buyers faced during the peak frenzy of the pandemic has cooled too. Here are just a few trends that may benef… Read more
You’ve got questions and we can’t wait to answer them.